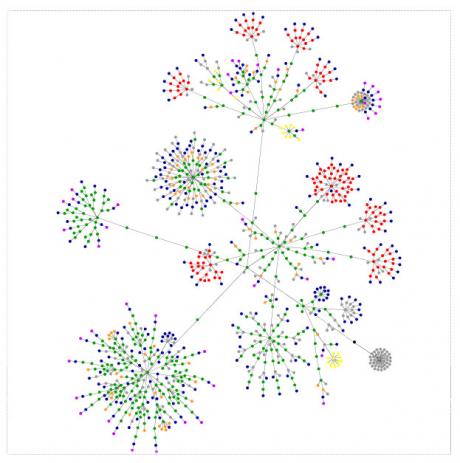
There is a new form of Art. It involves taking data from a source and generating it in a graphical form. It can be used for research and analysis but the images can also be considered a work of Art. Here is the graph for iranian.com. You can generate it for your own site at http://www.aharef.info/2006/05/websites_as_graphs.htm
If you leave the graph to render it forms an organic shape based on the html of the site.
blue: for links (the A tag)
red: for tables (TABLE, TR and TD tags)
green: for the DIV tag
violet: for images (the IMG tag)
yellow: for forms (FORM, INPUT, TEXTAREA, SELECT and OPTION tags)
orange: for linebreaks and blockquotes (BR, P, and BLOCKQUOTE tags)
black: the HTML tag, the root node
gray: all other tags


